I’ve long been a fan of Amazon’s premier database, Route 53, but its analytics have had something of a flaw. You’ve been able to see query logs for hosted zones for a while, but what about when you access other DNS “databases”?
Today, Amazon has released a new query logging functionality that helps you understand your access patterns much better. More prosaically, they let you meet a raft of compliance requirements should you lack imagination and use the service as a mere database.
Simply put, when enabled for a VPC, you’ll be able to see which resources inside of that VPC have made DNS queries, as well as what the results were. If you’re enabling this for compliance purposes, you’re going to want to block outbound access to the greater internet for both TCP and UDP port 53 from the VPCs or subnets you wish to log queries for. Otherwise, there’s a gaping hole for non-logged queries to pass through.
Let’s dive into the mechanics of how this new feature works.
Getting started
It starts with a new option hanging out in the left-hand menu bar, labeled “Query logging.”
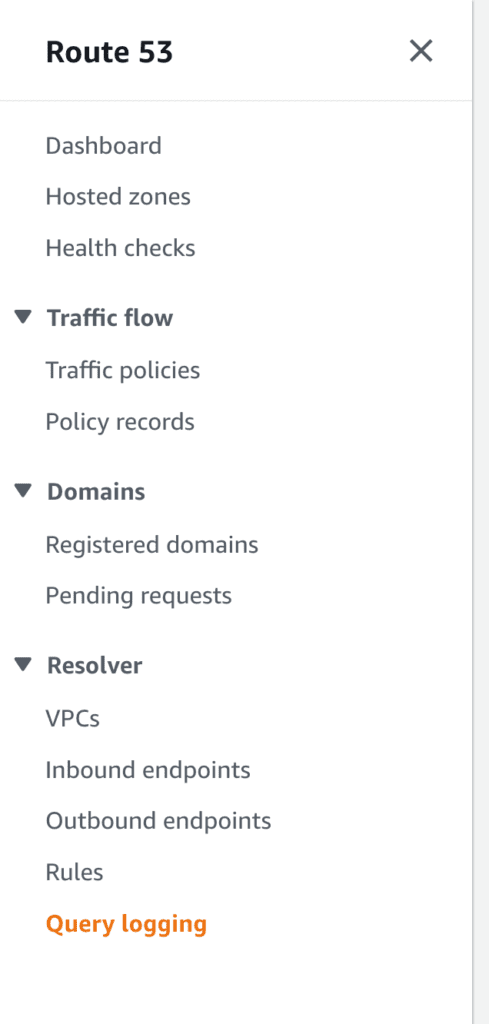
Note that if you haven’t set up Route 53 Resolver, it’ll instead display a first-time wizard that implies you’ll need a pair of endpoints to enable said resolver. This is incorrect; those things cost money, and query logging can be enabled for no additional fees on top of whatever logging service you use.
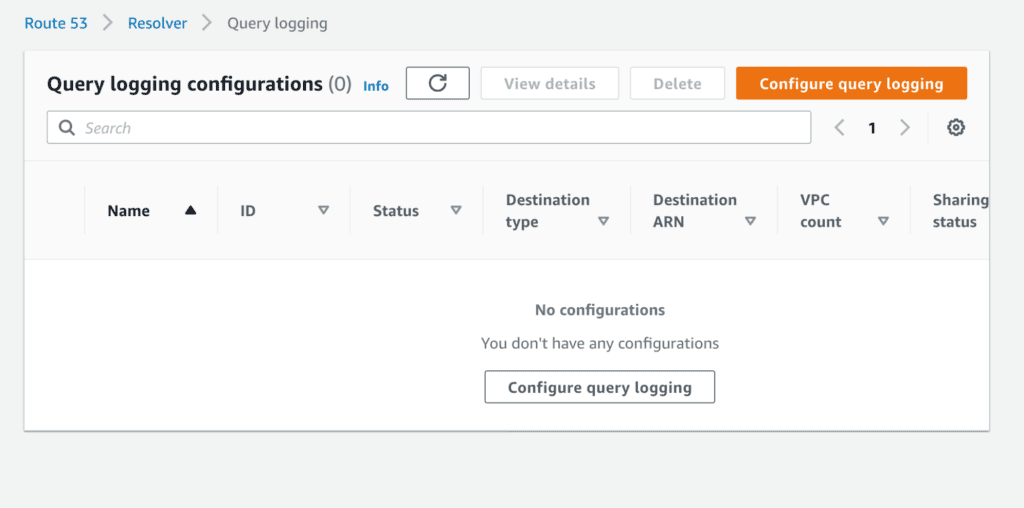
Configure query logging
From there, you’re prompted to configure query logging, as you’ve presumably been running your database blind until this point.
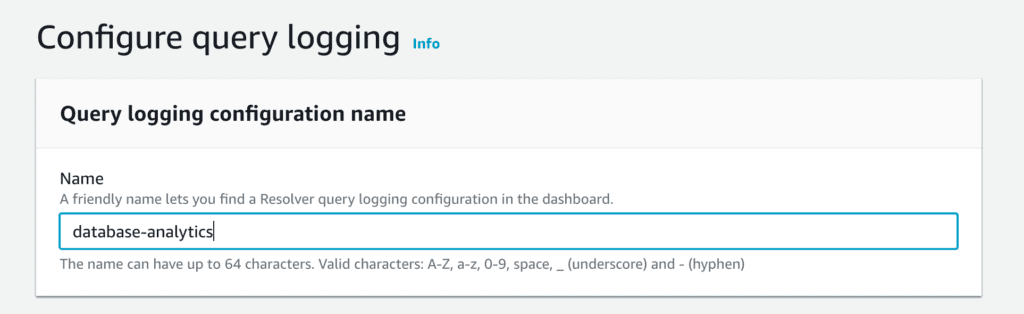
When you click the Glowing Orange AWS Button of Doom, you’re first prompted to give it a “friendly name.”
Today, we learn that “friendly names” have no whitespace, special characters, nor may they exceed a particular length—which means that different people interpret friendship very differently.
Where will your logs live?
Next, you’re given three choices as to where you want those logs to reside, with a variety of tradeoffs that aren’t really presented.
Let’s address each of these options one by one.
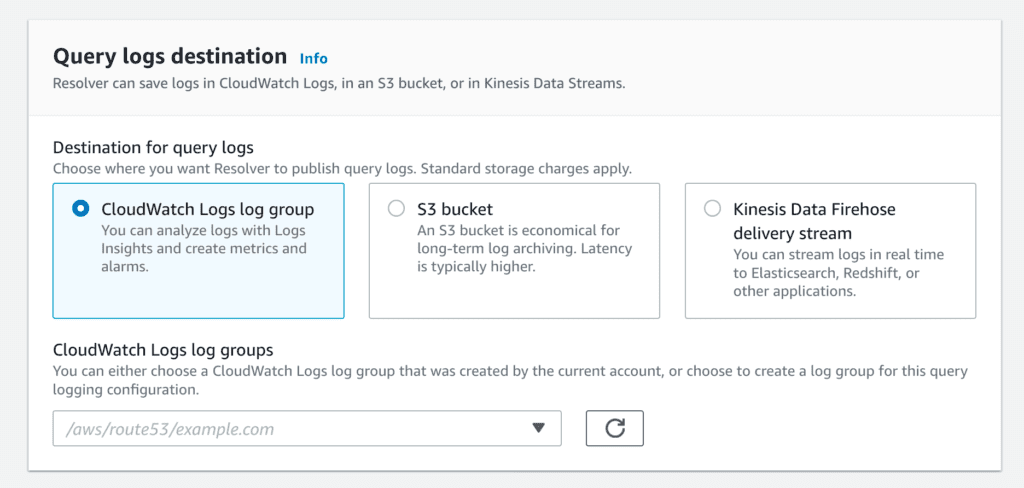
For CloudWatch Logs, you’ll be charged the princely sum of 50¢ per GB ingested, then a much more reasonable 3¢ per GB/month that the data is stored. Note that there’s no great way using this option to record the logs in a different account; this alone may mean this option isn’t on the table for some organizations.
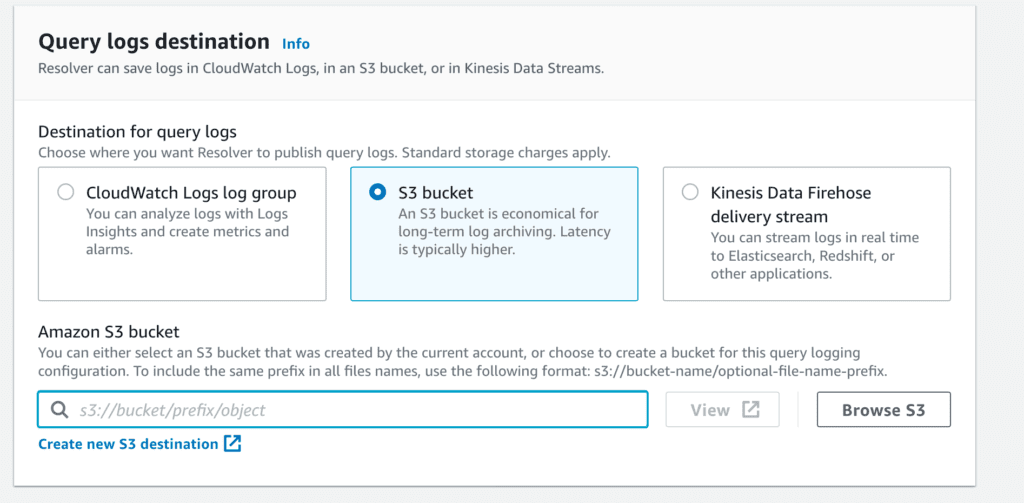
Our second option is an S3 bucket, AWS’s combination secure data storage/static website/ perpetual data breach root cause service. Easily configured cross-account, this queues any logging until either five minutes have elapsed or 75 MB of data have been gathered—whichever comes first. Then, it writes that data to your target bucket. This pause may or may not work for your various use cases, so you should be aware that it exists.
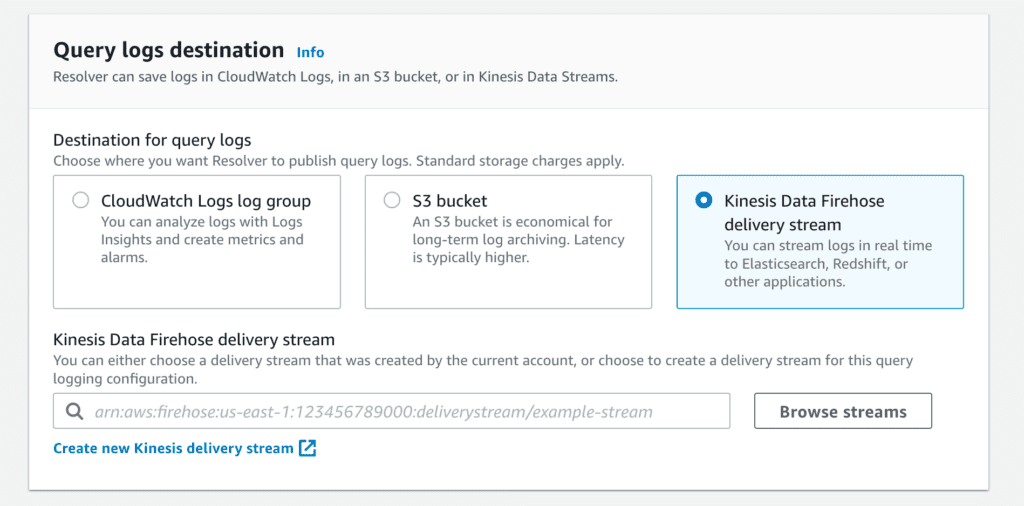
The third and most flexible option is via Amazon Kinesis Data Firehose. If you’re looking to have a cross-account story or else integrate into a pre-existing log analysis system, this is your answer.
The pricing here is highly variable and murky. In the usual U.S. regions, the pricing is 2.9¢ per GB ingested, an additional 1.8¢ per GB converted via Kinesis’s basic ETL capabilities (Parquet or ORC format output, specifically), then another 1¢ if you’re delivering it cross-AZ or cross-VPC. And then, of course, whatever the destination system (ELK? Splunk? Some monstrosity you’ve decided to EC2-it-yourself?) charges you for its own ingest / storage.
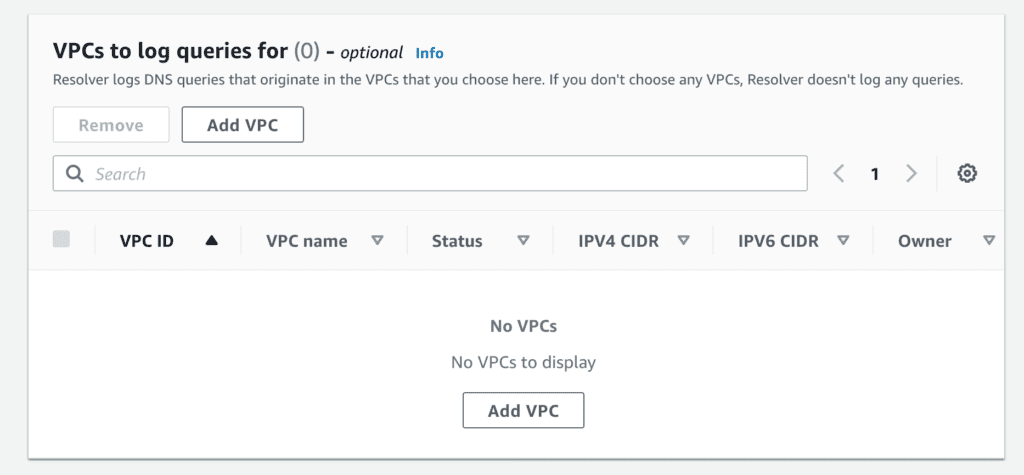
Assign the query logging configuration to a VPC
Next, you get to assign the query logging configuration to one or more VPCs. This should be fairly straightforward and require not much in the way of context. If you don’t see the VPC you’re expecting to see, great–you’re either in the wrong account or the wrong region; go back and start over at the very beginning.
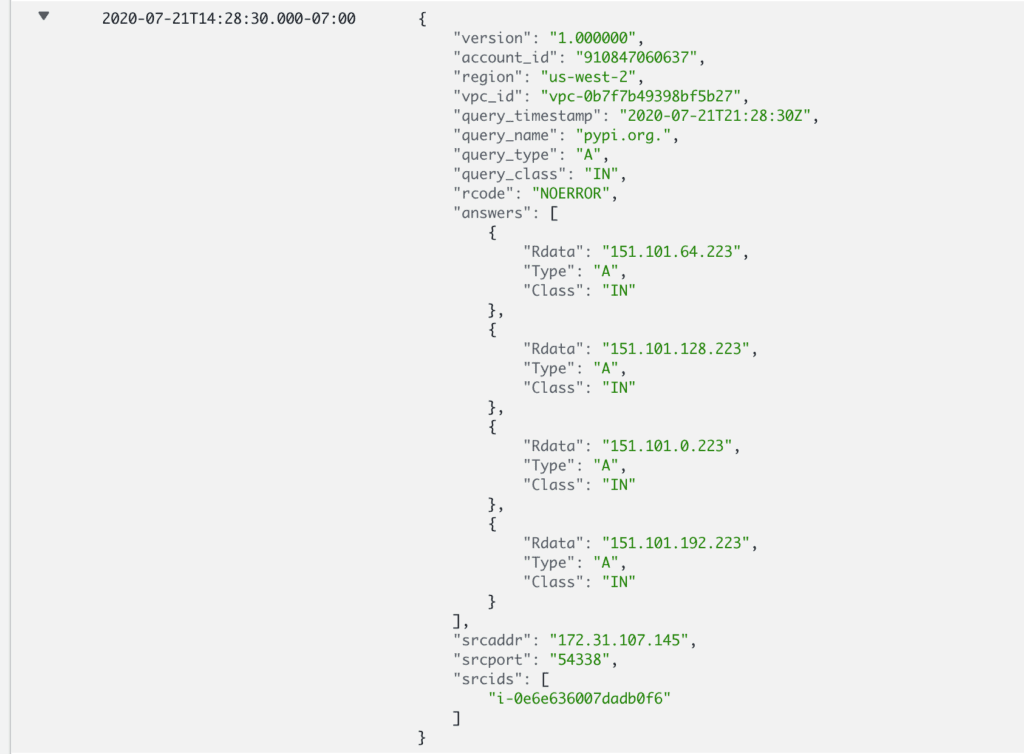
Once you apply the configuration, you’ll start to see logging show up—both for what was queried as well as what results were returned.
I want to highlight a few things here.
First, the source account ID, region, and VPC are handy for localizing logs. But what’s really useful, from my perspective, is the source address as well as the source ID. Combined with other logging facilities, this can help isolate query logs to specific instances—even ephemeral instances that may no longer exist.
Secondly, this is not bound merely to EC2 instances. Fargate containers and Lambda functions inside of this VPC would also be logged, as would RDS instances that for some godforsaken reason were configured to resolve and then establish outbound connections. (Note: This is actually possible but almost universally condemned.)
So what?
This concludes the how of configuring Route 53 query logging. But why would someone care?
I have two use cases that are relevant.
The first and less exciting is troubleshooting strange behaviors. If you’re seeing strange operational issues (particularly with ephemeral resources—and heaven help you if the issues are intermittent!), then being able to see what’s being asked and answered at a DNS level is very helpful.
The second, which is far more interesting to most folks, is of course security: better known as “that thing you attest is your number one priority right after it’s been very publicly demonstrated to be an afterthought.”
I’ve mentioned above how I abuse DNS as a database. But other folks misuse it as a means of data exfiltration. Without seeing what queries your systems are making and receiving, it’s very hard to detect this method of abuse. Fortunately, compared to normal traffic on a constrained application, this type of DNS query traffic tends to stick out rather significantly.
In some shops, the lack of query logs has been a key part of their compliance positioning. Without a viable and robust query logging capability, the strength of that compliance attestation rests on companies disabling Route 53’s resolution capability and instead running their own—a situation nobody wants.
Lastly, it’s great to be able to see exactly what my database queries look like. Now all I need is far more granular timestamp data so I can start doing database query latency analytics in my spare time.